Radiation Detection and Analysis System
Introduction
Radiation passing through material media interacts with it and deposits energy in it. The nature of interaction different for heavy charged particles, fast electrons, gamma radiation, charge less particles etc. Heavy charged particles, heavy compared to electron, mainly interact with the orbital electrons of the media through coulomb forces and loses its energy without much change in its direction. The fast electrons undergo large number of collisions with the orbital electrons and undergo large direction changes. The gamma radiation interacts with the media by processes like photo electric absorption, Compton scattering and pair production. /1/
All the above processes generate electric charge within the active volume of the detector. A suitable bias voltage is applied to collect this charge. When the rate of radiation is not very high the charge generated by individual events can be collected and analyzed. The following paragraphs explain the experimental setup, developed at Nuclear Science Centre, for generating the energy spectra of incident radiation.
The Equipment
The basic building blocks are the Detector, Pre-Amplifier, Shaping amplifier, the Analog to Digital Converter and the Multi Channel Analyzer implemented using a PC., as shown in figure 1. The modular design permits the usage of the building blocks separately or together. Each of them are explained in the following sections along with the circuits implementing them.
A semiconductor P-N junction can be used are a radiation detector. The depletion region of the junction can act as the active volume of the detector. Any radiation passing through this region will generate electron-hole pairs that can be collected from the electrodes connected to the junction. A reverse biased junction gives a much better performance. It increases the width of the depletion region to reduce the junction capacitance and hence reduced noise. It also improves the charge collection efficiency. The solid-state junctions specially made for radiation detection are very expensive. We have tried to use a one sq.cm area junction, a solar cell, bought from Silicon Sensors, USA, as an alpha particle detector. It gives about seven percent energy resolution in air with out any reverse bias voltage. In vacuum we obtained around 3 percent by applying a 12 V bias voltage. This inexpensive detector is sufficient for alpha particle and fission fragment detection and energy measurement. Those who already have silicon surface barrier detectors can connect the same to the Pre-Amplifier input of the unit. Bias supply needs to be given externally since the built-in supply does not allow ramping or voltage adjustment. It is meant for only the solar cell detector under vacuum.
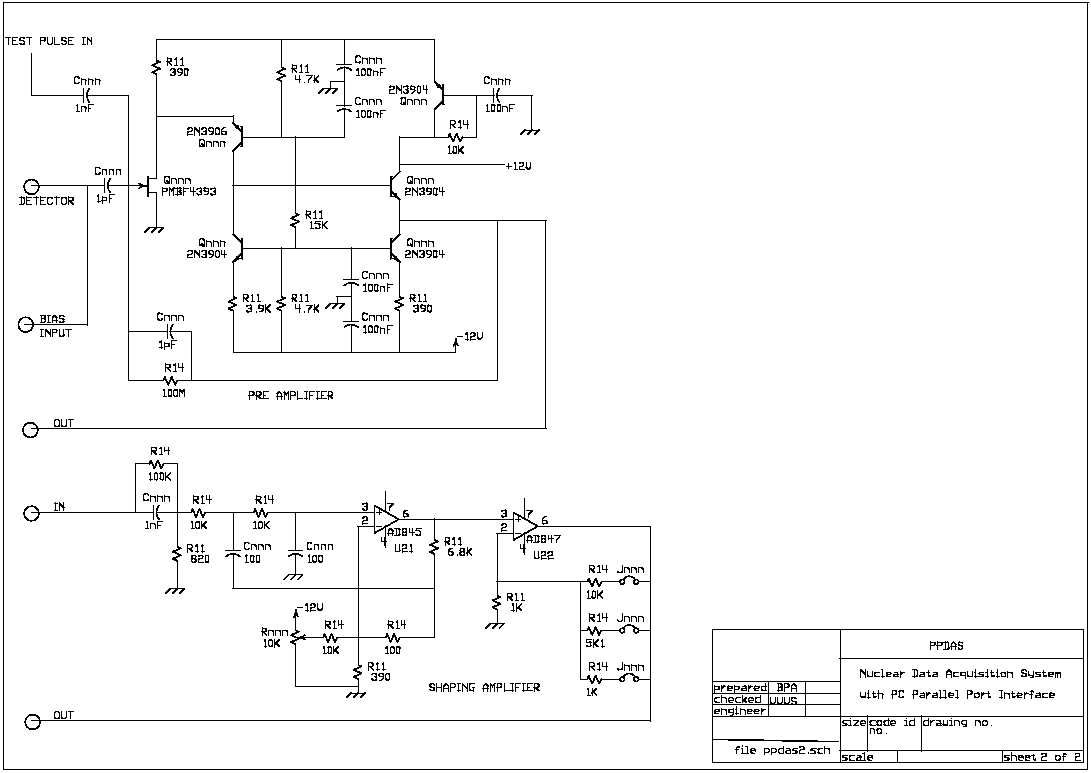
The charge sensitive pre-amplifier has a FET at the input in cascode with a BJT. The feedback capacitor decides the gain or the charge sensitivity. A high value resistor is connected in parallel to discharge the capacitor. This circuit has used one pico farad in parallel with 100 Megohms.
For silicon detectors, the theoretical gain for this circuit is 44 mV / MeV. This is calculated as follows
Energy required to produce one charge pair = 3.62 eV for silicon
Total Charge Q = (1000000 / 3.62) x 1.6 x 10-19 C => V = Q / C = 44 mV
According to this 5.48 MeV alpha particle from 241Am should give 240 mV but due to the non-zero capacitance of the detector, the measured value ranges from 150 to 200 mV. The rise time of this pre-amp is 50 ns with detector and fall time is 100 usec.
The Pre-amp output cannot be digitized directly. It is converted into a gaussian pulse whose amplitude is proportional to the charge collected. The shaping amplifier has one differentiator followed by a second order active integrator to get a near Gaussian pulse shape. The pole-zero compensation is done by the resistor in parallel with the Differentiator capacitor Cd.
The DC offset is corrected by adjusting the variable resistor Roff.
The Peak Sensing Circuit and A/D Converter
The output of the shaping amplifier is a Gaussian shaped pulse. The peak value of that is sampled and digitized. The pulse is accepted for digitization if the amplitude is greater than a threshold value, set to 100 mV. The functioning of the circuit is explained below.
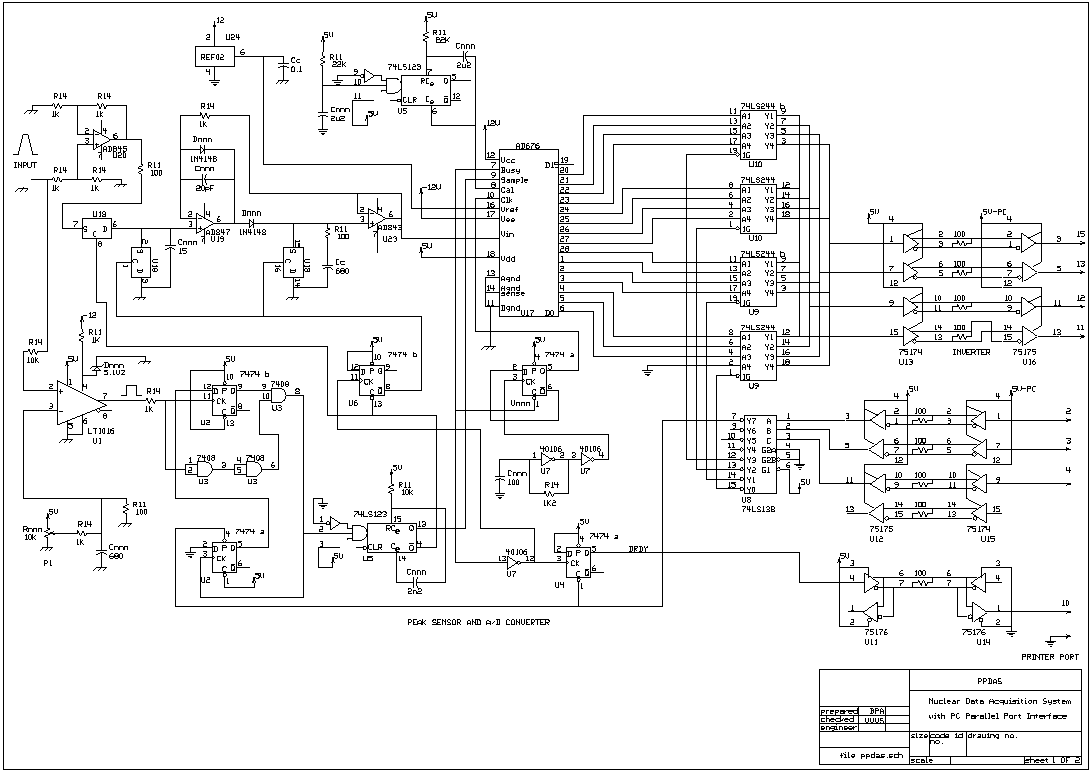
If the input pulse is larger than the threshold, pin number 7 of the comparator, LT1016, will go high. This rising edge will transfer the status of the READY FLAG (pin 5 of U2-A) to the output of U2-B. If READY is high, the mono-shot U5 is triggered and READY flag is cleared. The Q output of U5 puts the ADC chip, AD676, in the SAMPLE mode and closes the series switch, ADG201HS. It also clears the flipflop U6 to open the parallel switches. The BUSY flag logic is done in such a way that the FLAG is sampled only at the rising edge of the pulse, eliminating the possibility of it coming true in the middle of a pulse and digitizing erroneous data.
Now the incoming Gaussian pulse starts charging the capacitor Cc to the peak value of the pulse. After 10 microseconds, the mono-shot output goes low to take the SAMPLE pin of ADC low. At this point the ADC starts conversion and at the end of conversion the BUSY signal, AD676 pin 7, goes low. The falling edge of BUSY is inverted to set DRDY, pin 5 the flipflop U4.
The Q output of U4 goes to a differential line driver and is connected to pin 10 of the printer port. The rising edge of it sets the bit S6 of the status register of the printer port. It also generates an interrupt provided it is enabled by setting bit C4 of the control port. Once this bit is set, the computer should read the ADC output. It should also clear the DRDY flag and set the READY flag so that the system is ready to process another pulse. The time taken for processing one pulse is the dead time of the system. It is around 35 microseconds, 10 for shaping, 15 for conversion and 10 for reading the data.
The printer port in the normal mode can only output data, it cannot read. But it has 5 status input bits on its status port. We utilize four of them to read the 12 bit ADC data in 3 nibbles. The ADC data lines are connected to four quad buffers, 74LS244, and one of them is selected at a time by writing the buffer address to a decoder, 74LS138. The decoder inputs are connected to three Control Port pins C0, C1 and C2.
The differential line drivers 75174, 75175 & 75176 are only to isolate the PC ground from our circuit ground. The PC ground shows around 300 mV noise when measured with the oscilloscope and digitizing a 5V pulse into 12 bits corresponds to an LSB of nearly one millivolt. The AD676 is a 16 bit Successive Approximation Register type ADC that accepts -5V to +5V input. We are giving only positive voltage and ignoring the MSB, the sign bit. The three LSBs are also ignored to use it as a 12 bit ADC. The DNL of SAR type ADCs are not good enough for pulse processing, however rejecting the LSBs gives acceptable performance.
Programming Considerations
The PC parallel port interface consists of Three addresses on the I/O space,
DATA port --- 378hex
STATUS port --- 379hex
CONTROL port --- 37Ahex.
We are using the four Bits of the STATUS port to get the ADC data and 3 bits of the DATA port to select the outputs of a decoder. The only care needed is to reconstruct the 12 bit data from the 3 nibbles read through the STATUS port. The procedure is explained below along with program to do it.
The bits S3, S4, S5 and S7 are used for reading ADC. S6 is avoided since it is used for controlling the interrupts. Our Linux based program is interrupt based for better efficiency. It is seen from the above diagram that the Data should be shifted by three bits to the right and S7 should be shifted to S6. This will give as the data on the 4 LSBs. Read the three nibbles separately after opening the three buffers one by one and combine them to form a 12 bit word.
Let us examine the complete program to generate a histogram. The program waits in a closed loop for DRDY and every time it finds one, the ADC is read and the flags are set to keep the system ready for the next pulse. A 4096 element array is defined and the ADC data is used as an index to increment the value.
outp(DATA, 7); /* clear DRDY flag and set ADC READY*/
outb(DATA, 0);
for(;;)
{
if(inp(STAT) & 64)
{
data = readADC();
++hist[data];
outp(DATA, 7); /* reset flags */
outp(DATA, 0);
}
if(kbhit()) break;
}
for(k = 0; k < 4096; ++k)
fprintf(fp,"%d %6.0f\n", k, hist[k]);
fclose (fp);
}
The code above will collect data until you press a key. It will run only on Turbo-C under DOS. Even though it is simple it suffers from one drawback, the poll mode Input/Output. The CPU keeps on executing the input instruction to check the DRDY flag. This wastes CPU time as well produce disturbance to the ADC board. The Linux based software utilizes the interrupt feature and the CPU is called only when there is a DRDY signal.
The GNU/Linux based software for Data Acquisition
Writing programs to communicate with hardware peripherals in a multi-user operating system like GNU/Linux is different from doing it in DOS. The normal user programs are not allowed to communicate to the hardware directly. One need to write a device driver and install it and it require the super user ( root) privileges. It is also possible to write a program similar to that of our DOS -TurboC based one, without any device driver, under GNU/Linux but only root user can execute such programs. This is done by using a system call to get access permission on selected I/O addresses. Such a program, “pol.c” , is also included in this report.
To write a program that can be used by all the users, we need to write a device driver. How to write a device driver is explained in the documentation on the GLUE CD, given along with this report. Here we will only explain how to install device driver and the user program to make a histogram.
The MCA subdirectory on the CD contains the following files
ppdas.c - The device drivers
mk - batch file to compile and load it
mca.c - The MCA programming
Makefile - For compiling the MCA programming
pol.c - The GNU/Linux program to read ADC ( root only)
hist.c - The DOS TurboC program to read the ADC
The subdirectories RH7.3, RH9 and Fedora contains the executable programs for those distributions
How to install the device driver and other programs
Login as root in the graphics mode and open an X-term. Change to the relevant subdirectory on the CD.
#mknod -m 666 /dev/ppdas c 60 0
This will create the device file for the driver. For details read the driver documentation on the CD.
# insmod ppdas.o
This will load the device drivers. Need to be done once after a power up. You can keep ppdas.o at some location and load it every time the computer boots by adding a line to the file /etc/rc.d/rc.local, like (assuming the driver is kept at /root)
insmod /root/insmod.o
Now copy the executable to /usr/bin or some other PATH
# cp mca /usr/bin
#cp pol /usr/bin
#mca
to start the program.
Note: The driver can be unloaded and reloaded by the commands
#rmmod ppdas
#insmod ppdas.o
In case of any trouble with “mca” program, try reloading the driver.
How to compile the driver and other programs
The device driver is in file ppdas.c. Login as root and copy the contents of the directory “MCA” to your home directory by;
#cp -r /mnt/cdrom/MCA .
#cd MCA
To compile and load the driver, execute
# ./mk
The batch file “mk” has the following commands in it
#gcc -Wall -O2 -c -DMODULE -D__KERNEL__ -I/usr/src/linux/include -o ppdas.o ppdas.c
rmmod ppdas
insmod ppdas.o
In case of compile errors make sure that the kernel sources are installed and the directory /usr/src/ has a link named linux in addition to the link linux-x.x.x ( where x.x.x is the version number) . If not make it by moving to /usr/src
# cd /usr/src/
#ln -s linux2.x.x lnux
Now come back and try recompiling
# cd /root/MCA
# ./mk
Now make the device file by
#mknod -c 666 /dev/ppdas c 60 0
To compile and run the MCA program, type
#make
#cp mca /usr/bin
#mca
to compile pol.c , type
#cc -o pol pol.c
The MCA program
The program “mca.c” is a simple C program that reads the ADC using the driver “ppdas” and plots a histogram on the screen. It uses X-Window graphics and the Motif Widget Library. The save button saves the histogram to a file named “hist.dat”. This can be further processed by any other off line program like the DAS program from NSC named “Freedom”. To load “hist.dat” into “freedom” , start it in the offline mode and Load “hist.dat” as Ascii format Spectrum.
Basics of writing X-Window programs are also given in the CD. The “mca” program is kept very simple for the ease of understanding the code. It does not support any extra features at the moment.
Offline Analysis
The offline analysis can be done by the program
'freedom' by loading the spectrum in ascii mode. This package can be
installed from the directory "freedom" by following the steps (as root)
Radiation Detection and Measurement by G.F.Knoll (John Wiley & Sons)
Tutorials on Pre_amplifier and Amplifier , from EG &G Ortec (on the CD)
Tutorial
on semiconductor detectors
& notes by Helmuth Spieler (pdf)
Data sheets of various components used in the circuit ( on the CD)
Freedom,
data acquisition system manual, NSC ( Does not have much info on
Offline analysis)